We recently returned to our discussion about antiracist research methods, and want to open a new dialogue about how we at DataWorks can engage with data in an antiracist way. In this blog series, we ask ourselves: “in what ways do we think about data that we may not even realize are racist?”
Which area? Whose income?
The Low Income Housing Tax Credit (LIHTC) is a program designed to encourage developers to build affordable housing by using tax credits. “Developers qualify for LIHTCs by agreeing to rent units to people with low incomes and to charge rents that are no more than a specified amount. Most tax credit developers choose the option under which the renters must have incomes below 60 percent of the area median income (AMI) and the rents must be no greater than 18 percent (30 percent of 60 percent) of AMI.” (Source: HUD PD&R Edge Magazine.)
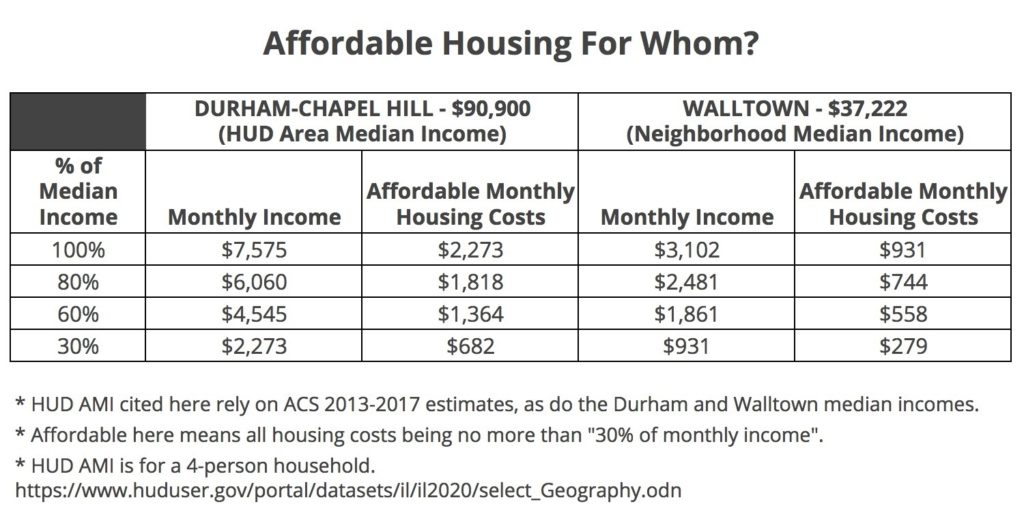
The AMI for Durham-Chapel Hill is $90,900. The metro area used in HUD’s AMI determination includes Chatham County, Durham County, and Orange County — all counties with distinctly different demographics and household incomes. The AMI for Walltown, one of Durham’s historically Black legacy neighborhoods, is $37,222 (see the chart below).

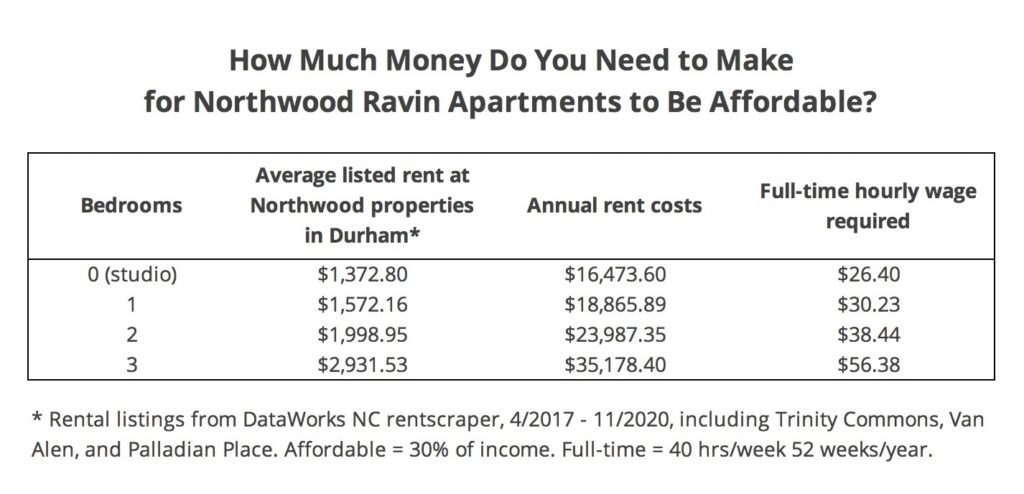
And therein lies the constraint of and the inequity in using this standard HUD determination of AMI. An affordable rent at 60% of the regional AMI is approaching half the monthly income for the median household in Walltown. When it comes to advocating for affordable housing this is the dead-end of discussion many of our community partners run into when engaging with real estate professionals and City agencies.
It just comes back again and again to how all of our real estate development, “affordable” or not, is designed to make profit for private developers first. We should reconsider whether creating housing for poor people requires a return on investment for anyone.
John Killeen, DataWorks
If the fundamental design remains the same, that is, defining “affordability” from the perspective of developers’ profits rather than residents’ ability to pay, then the results will be the same. Developers continue to benefit, building affordable homes for people with middle class income while the needs of poor residents are continually neglected. The metro area governments can bask in and benefit from increasing numbers of wealthier people moving to the area as a result of its ranking as one of the best places to live in the United States, ignoring residents who are displaced in the process.
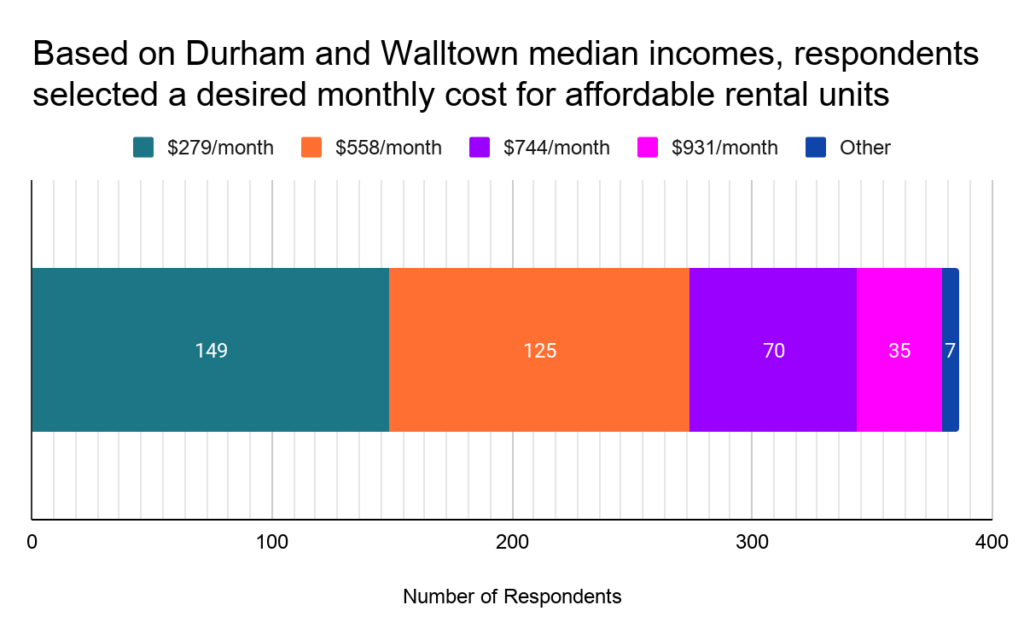
A survey of the Walltown Community Association is one example of what it means to redefine “affordability” by asking different questions and prioritizing residents’ voices.

What can we do better?
There are two major problems with using the Durham-Chapel Hill AMI to determine thresholds for affordable housing in Walltown and Durham’s other historically Black neighborhoods. First, the median income in the larger area is clearly inflated by wealthy households. The stark contrast between $90,900 and $37,222 says it all.
Second, summarizing the income of a metropolitan area into a single number hides individual experiences. Developing land for community benefit requires understanding the basics of community. In American geography communities are still segregated by race and ethnicity as well as by income. There is effectively no median household across these enclaves of divergent history – we need to see them each for who they are.
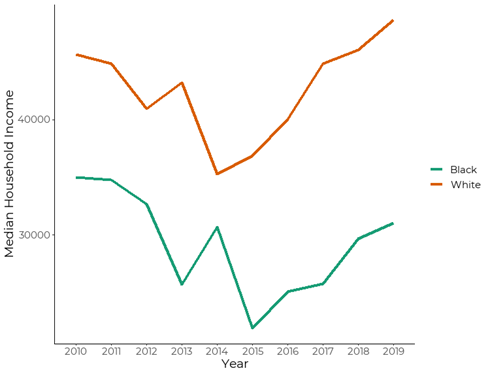
In Walltown, disaggregating by race begins to tell the story more clearly. Rising property taxes in the neighborhood are affecting all residents but act as a greater threat to displacement for some than others.

2000: $50,000
2010: $114,000
2019: $261,500
Who is driving tax increases and who is most impacted by them? The neighborhood’s long standing Black population has had consistently lower median household incomes than the white population in Walltown. High-income families increasingly moving into Walltown are driving the property taxes up, making it difficult for families who have lived there for decades (many for generations) to keep up.
In a recent analysis presented to the City of Durham, the Walltown Community Association and DataWorks explored Black-wealth in Walltown. The Walltown Community Association made the following recommendation to the city: The City of Durham has a clear choice to act to preserve Black wealth in Walltown, or not. As rising property taxes threaten the loss of people’s homes, the City can act to prevent that from happening. The solution is simple: for just under $100,000 of property tax assistance, the City could help preserve $12.2 million in Black-owned wealth among Walltown’s longest term residents.
How can we summarize in a way that benefits communities, rather than harms them?
In order to better reflect people’s experiences, we recently added disaggregated measures of median household income to the Durham Neighborhood Compass–it can now be mapped by race and ethnicity: https://compass.durhamnc.gov/en/compass/MEDINC-BLACK/tract
Other possibilities include disaggregating by the amount of time families have lived in households, finding ways to represent who is benefitting from gentrification alongside who is harmed, and mapping opportunities to build intergenerational wealth. We welcome ideas and feedback from readers and community partners as we develop this vision.
This is part 2 of a multi-part blog series that documents our critical thinking about antiracist data methods.
Antiracist Data Methods Series:
Anti-Racist Data Methods-Part 1: Voices as Data
Anti-Racist Data Methods-Part 3: Rethinking Timelines and Trends


This is great! I really like the disaggregated measure median household income by race and ethnicity.
I think something may be off with the data for Hispanic or Latino/a household income. According to the map, median income for these households are in the billions of $ or hundreds of millions.
Thanks for pointing that out! It was a data error that should be fixed now.
One thing I keep wondering about this — HUD uses the metro area to determine AMI in some places, and uses the county AMI in other places. It seems like an administrative determination someone is making, which has outsized impact on the housing market.
Is it possible there’s some sort of appeals process with HUD to ask that they revert to county-based measures for Durham (the County AMI, while still higher than neighborhood median incomes, is quite a bit lower than the MSA)?