We often discuss how many people move to Durham every day, rightly pointing out that Durham is a desirable place to stay. And new folks drive home construction, sales, and rising tax revenues in our county. The often-repeated figures vary – 20, 28, 30 people per day – and the sources are not cited. But we assume that they are a net gain, reflecting people coming to Durham and people leaving as well. We turned to data published by the Internal Revenue Service (IRS) to ask our question. What about the number of people leaving every day?
The IRS publishes County-to-County Migration tables which compare the county where people live to where they last filed their taxes. These tables breakdown both the number of returns filed, which is used to describe the number of households; and the number of exemptions included in tax returns, which is used to describe the number of individuals represented by the number of returns. We created this table of per-day counts by simply dividing those totals by 365.
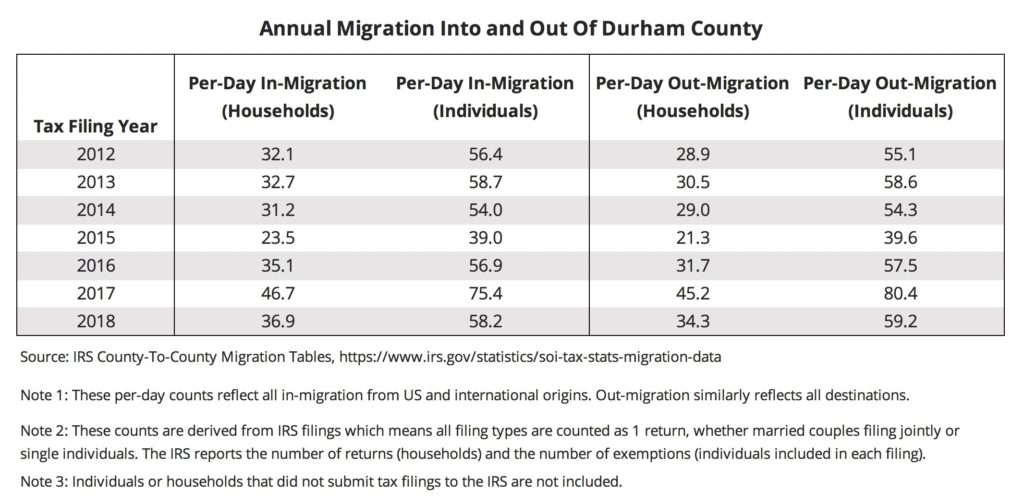
Quick Take on These Per-Day Numbers
To give an overall sense of scale, the number of tax returns filed by households that left Durham during 2017 was 12,524 (21,255 individuals). And the number of those who moved to Durham in 2017 was 13,466 (21,616 individuals).
The number of households coming to Durham per day, while varying each year, has ranged from 31.2 to 46.7. And as you might expect the number of individuals included in those filings is higher, reflecting roughly 1.5 – 1.8 people per household.
The number of households migrating out of Durham each day has mirrored the annual variations of in-migration. There have been between 21.3 to 45.2 households leaving Durham County per day since 2012. The number of individuals reflects approximately 1.7 – 1.9 people per household.
In very generalized terms, the difference between in-migrants and out-migrants to Durham each day appears to be a couple or three households, with the ones leaving somewhat larger than those arriving.
Centering Our Displaced People
Obviously, the IRS data offer a very different glimpse of migration than we often hear. But the point of this piece is not so much to disprove that commonly-cited statistic (although it would be helpful if folks using it could explain it). We are more interested in centering the people leaving Durham, and particularly among them the people who would like to stay but cannot.
The table above suggests as many questions as answers for us: Who are they? Where are they going? What makes them leave? But the main thing it tells us is that there are many people leaving Durham. In fact, the number of people leaving may not be very much smaller than the number arriving. We know people come and go for all kinds of reasons – college, jobs, family, and gentrification included. And that’s part of our point here, actually. The net number when we’re talking about migration, whether gain or loss, is perhaps the less meaningful part of this story. Community support, policy, and programs respond to why, how, where our pain points exist. From anecdotes and interviews we’ve done with displaced people we know that housing costs, unstable leases and unavailable Section 8 homes contribute to the issue.
In such a period of rapid and damaging gentrification as this our institutions have been planning a great deal for the 20-30 people coming here every day. It’s a handy number and it serves the agenda of economic growth and real estate development. And we’ve put a lot of eggs in that basket. But it is a very problematic number because it masks everyone our community loses on the other side of the equation. We have oriented our community planning to serve the newest person in the room, effectively, while the rest of the community is trying to deal with history and pay the rent and taxes. Or find a new home.