We recently returned to our discussion about antiracist research methods, and want to open a new dialogue about how we at DataWorks can engage with data in an antiracist way. In this blog series, we ask ourselves: “in what ways do we think about data that we may not even realize are racist?”
What does it mean to ‘center’ Black voices?
We hear people talk about “centering Black voices” in community organizing and local government conversations, but it sounds pretty academic and abstract to us. In this post, we’ll discuss organizing work of the Bragtown Community Association and what DataWorks can do better to understand and realize centering Black voices in Durham communities.
“I’m functional. But my hip hurts when I walk too far.”
Constance Wright, Bragtown Community Association Vice-Chair

Bragtown community residents
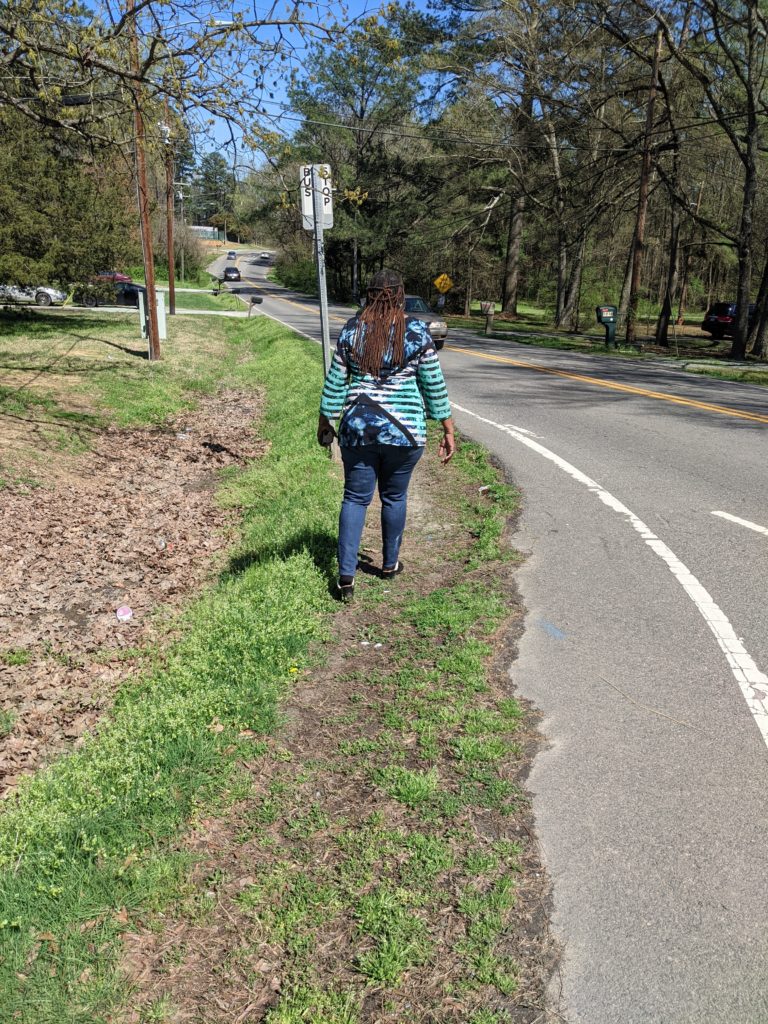
At first glance in the eyes of the City, Club Boulevard is a “functional” two-lane street. But when Constance Wright, the Vice-Chair of the Bragtown Community Association heard her neighborhood street described in this way, she replied, “I’m functional. But my hip hurts when I walk too far.”
Say’s who?

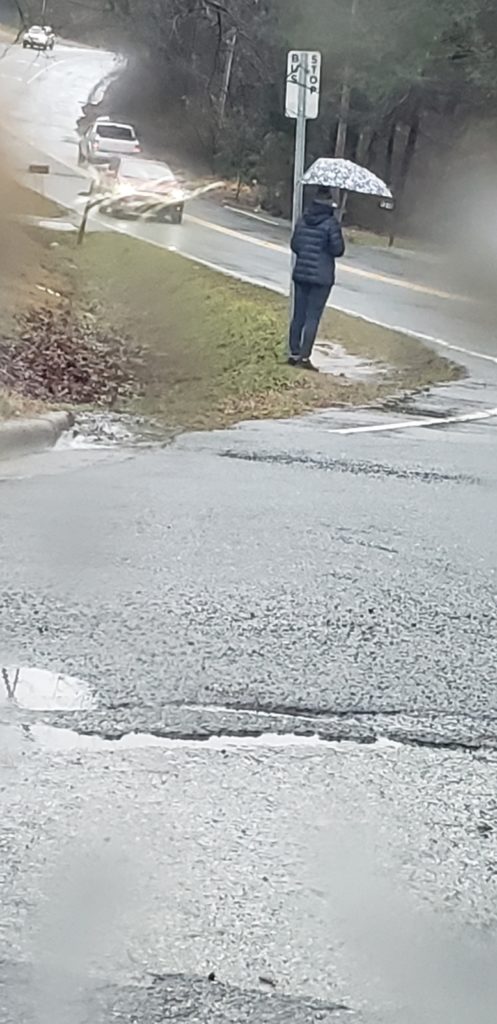
From the vantage point of a pedestrian or a student waiting at a bus stop, Club Boulevard is a street devoid of the basic infrastructure needed in order for residents to feel safe — covered bus shelters and sidewalks. If it is unsafe, it is anything but functional.
Additionally, according to some residents of the Bragtown community, the City of Durham Transportation Department and NC Department of Transportation have planned to install sidewalks on the South side of E. Club Boulevard. However, residents weren’t included in the decision-making. If they had been, if their voices had been centered, they would have urged the public agencies to install them on the North side, where most of the residents live.
Club Boulevard is one of many streets that residents say is unsafe. And it is unsafe, if they say it’s unsafe. Therefore, centering Black voices is hearing Black voices, valuing their voices as data, and acting on the recommendation of these voices.
Through our work with members of the Bragtown community, we continue to learn what is important to them. Below are some of the ways centering their needs and what data matter to them have become part of our practice.
What DataWorks is doing
In our work with the Bragtown Community, we try to center the voices of Bragtown residents. This mostly means showing up and listening. The Bragtown Community has been convening meetings and attending city government hosted meetings regularly for years. A DataWorks team member is almost always present for these meetings, and we believe that centering residents’ voices means residents tell representatives what is unsafe in their neighborhood, not the other way around.
DataWorks’ role is to listen and record the content of meetings. These records inform our team of what Bragtown is working on and needs, as well as serve as ongoing documentation of what happens at each meeting. If needed, these records can contribute toward holding representatives accountable to the community. Despite these combined efforts, community members have received less than satisfactory responses to their requests for added safety measures.
What can we do better?
Bragtown’s efforts show how the work to keep neighborhoods safe falls on the community, rather than developers and political representatives. What we hear from developers and representatives tends to focus on documentation of outcomes instead of process. This forces community members to trust the opaque process and figure out on their own how to participate. But community members don’t get to decide what counts as data and what issues get prioritized.
“I don’t care about bike lanes. Our priority is sidewalks.”
Bragtown Community Resident
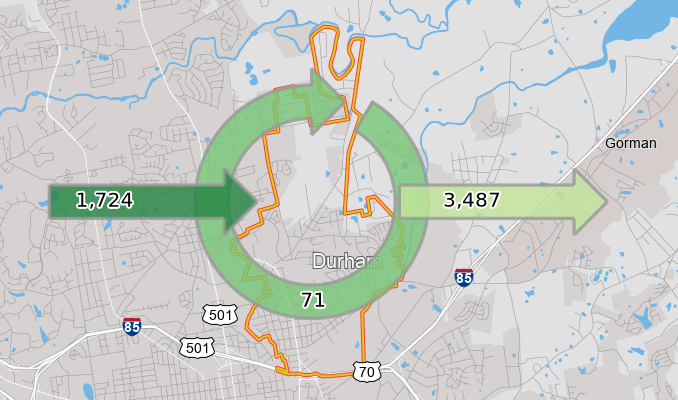
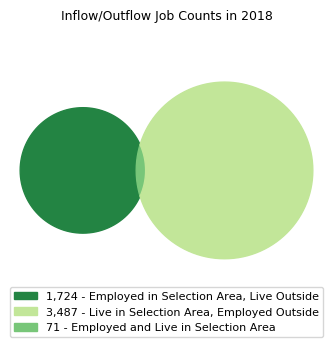
There are more resources and power behind efforts to bring bike paths to Durham neighborhoods than sidewalks – a white perspective centered. This is an issue we may be perpetuating through certain metrics in the Durham Neighborhood Compass. For example, the infrastructure section’s first metric is “Commuting to Work by Bicycle,” a statistic that doesn’t reflect experiences in Bragtown, where 98% of residents work outside of the neighborhood (2018 American Community Survey Data).


This is clearly a limitation from our data source, the American Community Survey (ACS). Data from the ACS about transportation are framed around the workplace; data that ignore the importance of transportation (including walking) for trips to get to school, the grocery store, or to visit family.
Further, the sidewalk data in the Compass shows aggregate sidewalk coverage within census block groups. This aggregation hides individual sections of street that are very dangerous, like the curve that begins just before Maplewood Drive and ends just as you approach New Covenant Church when traveling south on Dearborn Drive – the curve known to many Bragtown residents as “dead man’s curve.”
We think we can begin to do better by putting relationships before quantitative methods. Regardless of how much data support an initiative, what matters is who is present in the delivery, guidance, and leadership of the work. The experiences of people need to be uplifted and given power as the valuable data they are.
When we accept the established data sources, and value them over community voices, we fail to recognize that people’s experiences are infinitely more valuable data than the standard statistics.
How can we incorporate the Bragtown Community perspective into our data tools, like the Durham Compass?
We maintain our own accountability by doing directly responsive and meaningful work for partners like Bragtown outside of data portal projects. But we believe centralized, publicly-accessible data resources are completed or fulfilled by incorporating community knowledge. Through this series of blog posts, we are beginning to critically evaluate the ways in which variables in the Compass unintentionally recreate racism (for example, centering cars over people and jobs over families). We will reach out to our community partners for feedback on our measurements. They may see things we don’t, and the work will contribute to our relationship-building.
Antiracist Data Methods Series:
Anti-Racist Data Methods-Part 2: Area Median Income
Anti-Racist Data Methods-Part 3: Rethinking Timelines and Trends

Leave a Reply