This month, DataWorks NC released new residential property sales price data to the Durham Neighborhood Compass. While we already have a few other metrics which track the rapid changes in Durham’s housing market (such as tax value change and evictions), the new data gives a much more detailed look at how actual market sale prices are changing year-to-year.
Data show gentrification’s impact across Durham neighborhoods
Along with the Compass’ new neighborhood search function, this data show how home prices have been changing across different parts of Durham. In particular, you can use the new data in the Compass to see clearly how gentrification is impacting downtown Durham neighborhoods, by watching how their sale price trends compare with the County average.
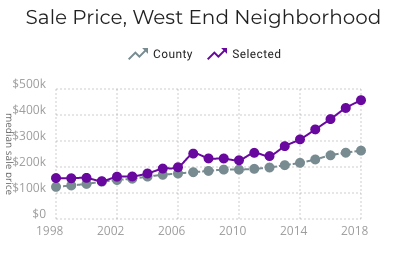
For example, Compass data for the West End, a neighborhood which has been gentrifying rapidly in recent years, shows how sales prices tracked close to the County median from 1998 until 2012, but have been increasing dramatically since 2012. Many downtown neighborhoods follow a similar trend of sale prices skyrocketing starting in 2012-2014, although for some neighborhoods (like Trinity Park), the price increase started earlier (2006) and has slightly leveled off in recent years.


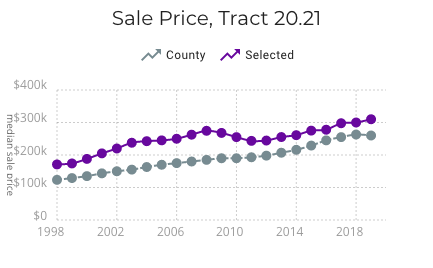
In contrast, in the census tract around The Streets at Southpoint Mall (Tract 20.21) homes have consistently sold for prices slightly higher than the county median, but that gap has narrowed in recent years.
More about the data
This dataset is generated from the Durham County Tax Administration sales records. We select the qualified sales for residential properties (e.g., not foreclosure sales or sales to family members), and generate a three-year rolling median sale price for each tract and blockgroup. If a tract or blockgroup had fewer than five sales during a three-year period, it is excluded from the dataset for that year. The sales values are not inflation-adjusted. For the time being, this dataset replaces our previous dataset on home values, which was sourced from US Census data.
Over the coming months, we’ll continue to release more datasets related to gentrification and development in Durham. If there’s something you’d like to see in the Compass, or if you’ve used the Compass data in your work, please reach out. We’d love to hear from you!

Thank you