It’s hard to imagine why it would matter to most Durham residents that high-end commercial properties are undervalued for property tax purposes. But what if you knew that simply having high-end commercial properties assessed fairly could have reduced your property tax bill by nearly 10% per year for the last four years? Or that this undervaluation of high-end properties is so significant that correcting it could be generating ~$35 million of property taxes per year for Durham?1
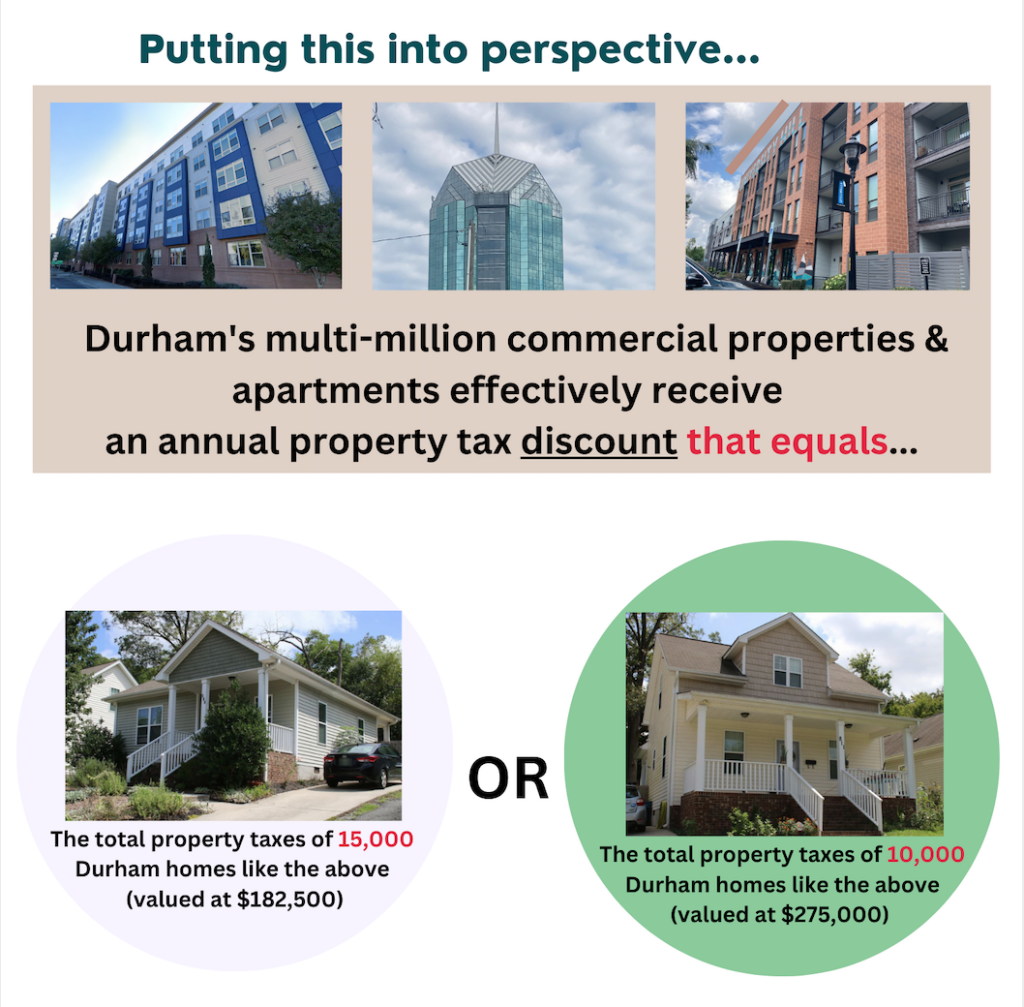
Durham’s multi-million-dollar commercial properties and apartment complexes appear to be underassessed by as much as $3 billion.2 $3 billion of assessed value in Durham currently generates ~35 million in property taxes. In other words, high-end commercial properties are functionally receiving a $30+ million discount in property taxes annually. To put this into perspective, this amount of undervaluation equals the total assessed value of over 10,000 median value homes in Durham. In other words, the property tax discount of high-end properties is equal to the entire property tax burden of over 10,000 average Durham homeowners.
Patterns of regressivity
An analysis of Durham’s qualified commercial sales from 2019-2021 (the first three years since the previous revaluation) shows a discernible pattern of regressivity within the commercial properties,3 including apartment complexes. This means that the highest sale price commercial properties are consistently undervalued and underassessed compared to lower-sale price commercial properties. These high-end properties are also substantially undervalued compared to the overall commercial sales each year. This disparity appears to be both significant enough and consistent enough to have implications for the entire county property valuation, and, in effect, the distribution of property tax burden for the whole county of Durham.
This last year, I worked under the guidance of UNC’s School of Government and in partnership with Durham County’s property assessor to analyze Durham County’s property tax data as part of broader research into the fairness and equity of property taxation. While my focus was on residential properties, I began noticing how many $50-$100 million properties had assessed values less than half of their sale prices. This led to research into the equity of commercial properties valuations at different sale price segments—and the impact of identified patterns of regressivity on Durham’s property tax distribution. The linked report includes the many ways I analyzed this data, the consistent patterns identified, and the methodology for estimating the implications of this regressivity.
Here are the key findings further detailed in the full report (link):
- Durham’s commercial properties show high levels of statistical regressivity each year, far outside of the International Association of Assessing Officers’ (IAAO) acceptable range. This means low-value properties appear to be assessed at a higher percent of their market value than higher value properties using standard assessment regression analysis measures.
- There’s a marked disparity between sales ratios at high, median, and low sale values. Sales ratios compare the assessed values of properties to their actual sale price (assessed value/sale price= sales ratio). In North Carolina, all properties are supposed to be valued at 100% of their market value. Analyzing sales ratios is one of the primary methods used to explore the relationship between the assessment value and market rate value, as arms-length sales are one of the best indicators of actual market value. Higher sales ratios point to potential overvaluation while lower sales ratios point to potential undervaluation.
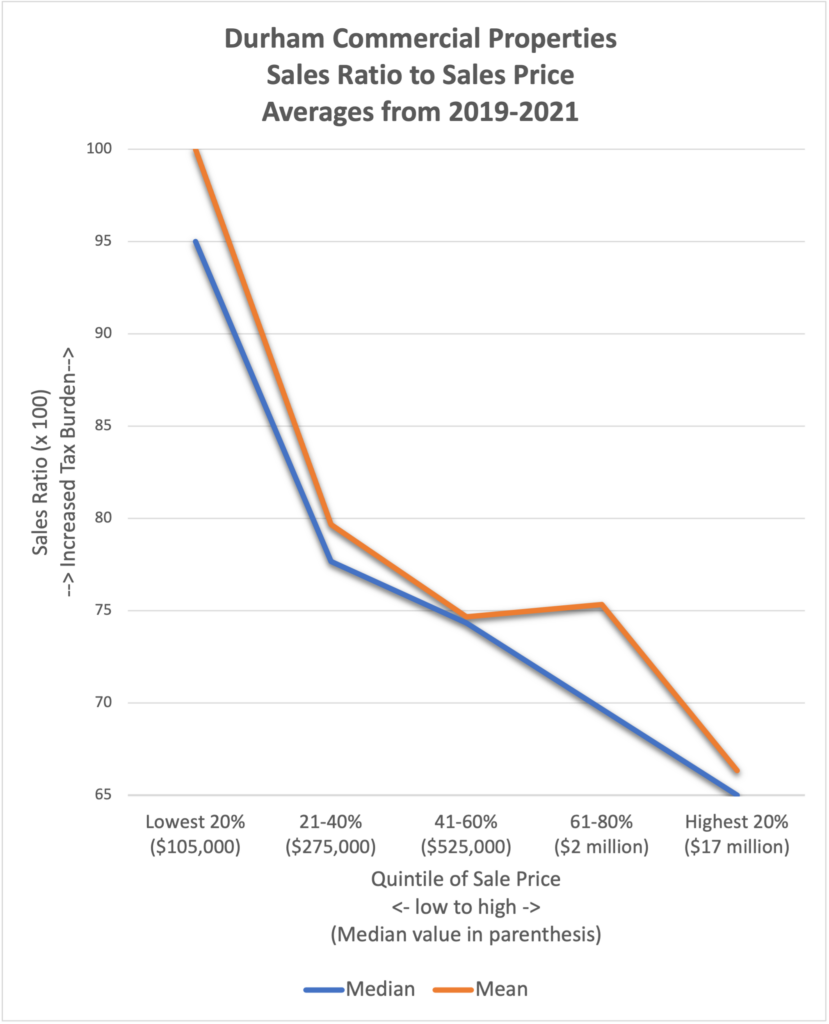
In Durham, high value commercial properties (top 25% of sale price) have average sales ratios that are 16% below the average sales ratios for all commercial properties and 32% below the low-price sales. These disparities increase at the extremes, increasing the impact on the property tax distribution. The graph below shows the clear pattern of regressivity (sales ratios declining as sales prices rising) across the three years.4 - The findings are not skewed by a few extreme values. Nearly four times as many individual properties in the highest decile of sales are underassessed compared to lowest decile of sale properties across the years.
- The findings of regressivity are consistent across all three years. The disparities are present starting in the year of the last revaluation and continue to the most recent full year of qualified sales, showing that unequal sales price growth has not been the primary cause of the findings.
- The implications of this undervaluation are significant: Durham’s multi-million dollar commercial properties and apartment complexes appear to be underassessed by ~$3 billion.

This chart looks at what happens to sales ratios as sales prices rise. In a perfectly equitable system, both the red and blue lines on the graphs would be horizontal. If there were no discernible patterns, these lines would look more like a heart monitor, with little rises and dips. Instead, there’s a clear regressive pattern (a downward slope), most noticeable at the high and low quintiles. The higher price sales have a much lower sales ratio, and in effect, a much lower tax burden by value. Sale quintiles (20% segments) are used each year to provide a consistent distribution and number of sales. The chart averages the quintile statistics from the three years, meaning each quintile dot represents ~120 sales. Both median and mean values are represented to show that the patterns are reflected in both.
The impact of systemic undervaluation
The systemic undervaluation of high-value commercial properties is large enough to impact Durham’s overall property tax distribution and its revenue-neutral tax rate. If Durham were to capture that $3 billion in assessed value, that additional value would allow Durham to lower the tax rate by almost 10% and still produce the same amount of property tax revenue at its current rate.
For an owner of a $295,000 home, this would mean ~$335 less per year in property taxes. That may not sound like much, but consider that in the six years between revaluations, this is over $2,000 for each of these homeowners. Or, for a neighborhood of five hundred of these homes, that’s $1 million in essential community dollars overpaid while providing effective tax breaks for the investors of $50,000,000 luxury apartment buildings.

Once I started to ask a range of assessors and property tax experts across the state about the possibilities of high-end commercial properties and apartment complexes being undervalued, their responses were forthright. One immediately described a pattern to me of luxury apartment owners sending a half dozen out-of-town lawyers to appeal values they don’t like – and appealing to the state’s Board of Equalization and Review to pressure the county to come up with a compromise if local boards aren’t favorable.
Given County Boards of Equalization and Review are volunteer boards with relatively limited time and mixed expertise, and the county attorneys are limited in their capacities to confront such high-powered appeals, most assessors seem to avoid these confrontations when possible. A member of one wealthier county’s Board of Equalization and Review even shared how a ~$100 million commercial development appealed for a $10 million reduction, and the County appraisers advised them to accept the revised amount without a clear defense of the existing assessment.
Furthermore, another appraiser described to me the extensive time and resources it takes to accurately appraise commercial properties, often requiring outside consultants and extensive efforts to get accurate income data from developers that is used in commercial appraisals. If assessors invest these resources to improve their valuations and then still lose appeals, it’s more drained resources with no added benefit to the county.
These are all valid responses with current realities, but given the implications of such vast undervaluation, one must ask whether it is worth the larger counties like Durham beefing up their commercial valuation capacity and their legal teams to assess high-end commercial property more accurately and to combat high-dollar appeals. Durham has its next reassessment in just more than a year, meaning the data gathering process is already underway. This is a critical window for community organizers and leaders to partner with and advocate for the tax assessors to address these inequities in the next reassessment – and for the County Commissioners to prioritize fairer commercial assessments in their oversight duties, especially given this inequity’s disparate impact on lower income homeowners and business owners across Durham.
A state-wide problem?
Our state law requires that all property be valued at market rate. In addition to looking at Durham, I have begun looking at Alamance, Orange, and Northampton Counties. Initial results suggest similar disparities in other counties, maybe to an even greater degree in counties with less assessment capacity. This raises the question: is this a state-wide problem? If so, what could our state be doing to help counties more accurately assess large commercial properties and to provide a more equitable response to high-dollar appeals? After all, the very largest taxpayers, many of them who live outside the state, seem to be getting significant property tax breaks in a state that claims that properties are being valued equally.
1Assessors are quick to point out that property tax rates are revenue neutral, so this would not result in additional tax revenue. The point is to show the implications to property tax burden. Additionally, what would have precluded Durham from adding $35 million for affordable housing each year into the budget covered by a correction to this undervaluation?
2 The estimations of the implications of this undervaluation are relatively conservative. This analysis looked at implications of undervaluation only compared to commercial properties. The mean and median sales ratios of commercial properties are lower than the residential sales and overall property sales ratios, and all of these are far lower than market value, so the actual undervaluation is likely more extreme.
3 Specifically real estate. This study did not assess the equity of business personal property, which can provide substantial additional property taxes from some commercial properties but was not found to be a significant factor in the sales ratio analysis, especially given the quantity of apartment complexes. This study is not assessing the economic value of commercial properties but the equity of property taxation on owners of the real estate.
4 Each year’s statistics were done separately, to not bias the data for annual growth. Combined averages were then taken of each year’s quintile statistics. Each of these points represents ~120 commercial/apartment sales.
Hudson Vaughan (UNC ’08) co-founded and served for a dozen years as a director of the Marian Cheek Jackson Center, a community development non-profit in the historically Black neighborhoods of Chapel Hill. While subsequently completing his M.Div at Duke, he pursued this research as part of a directed study on racial and vertical equity in property taxation at the UNC School of Government. As part of this work, Hudson also wrote a piece on the inequity of residential property taxation in NC and state policy issues at the heart of this that can be accessed here. He serves as a consultant for affordable housing and community engagement efforts across North Carolina, with a particular interest in mobilizing housing justice tools and community development strategies to prevent displacement in historically Black neighborhoods and support community self-determination.

Excellent article that shows the growing trend across our communities.
Not surprised at who wrote this insightful piece.
Thanks for doing these analyses, Mr. Vaughan.
The results are not surprising Sadly, the high-end developers play our local governments and planning departments like fiddles.
The Big Guys can out-maneuver and swindle you any time the set their minds and “experts” to it, as I learned many years ago while dealing with the coal and private utility industries.