This year, DataWorks NC is putting more time into ongoing development on the Durham Neighborhood Compass — this means that we’ll be launching new features for the Compass nearly every month, and it allows us to be much more responsive to your feedback, and to community needs!
We just launched the first new release of 2019, version 1.3.1 which includes the following updates and changes:
- A major clean-up of the internal code, and a switch to using VueX for state management.
- Integrated performance tracking using pwmetrics.
- Fixes to some bugs which were causing the Compass and reporting features to show a blank screen on older iPhones and on older versions of Internet Explorer.
- Some better caching for data layers in the Compass, so that when you switch back and forth between datasets they no longer re-load fresh data each time.
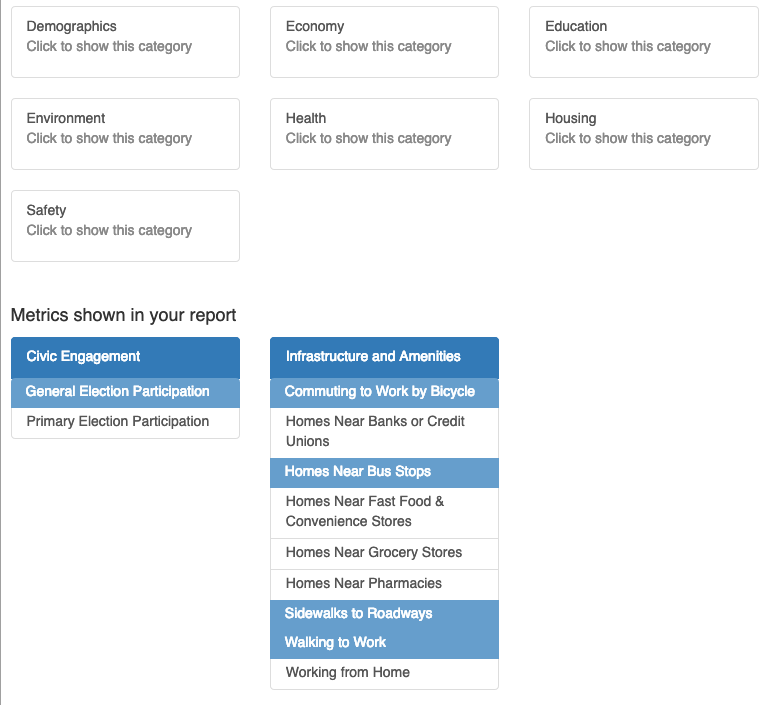
- A new “Customize this report” feature in the reporting interface, which allows you to turn on and off metrics to create a custom report which you can print or share via a link.
John Killeen has been using the new reporting feature to support the ongoing work of Durham’s Participatory Budgeting delegates!
To try making your own custom report, you’ll first need to select an area of the city and then click the “report” button, to get to the report page (this one is for Ward 1). Then click the small link at the top which says “Customize this report.” A popup dialog will open, which allows you to toggle on and off individual metrics to focus in on the areas you want to see. For example, here we’ve highlighted just voter participation alongside metrics about transportation for Ward 1.

Later on this year, we’ll launch more improvements, including:
- Print and embed mode for maps on the Compass
- Spanish translations!
- and a visual refresh to unify visual style across the Compass and the Health Indicators Project
As always, please contact us to share your ideas for the Compass!

Leave a Reply