In support of the Community Health Indicators Project over the past year, DataWorks and Research Action Design have been facilitating listening sessions, focus groups, interviews, and neighborhood workshops to learn what matters most about health in neighborhoods and how people prefer to use data about health. In neighborhood work sessions we have relied on a combination of consensus workshops and gallery walks to identify what types of images and data visualizations work best for neighborhood partners. These experiences, website user testing, and close collaboration with health program professionals guide the content and form of the new Health Indicators Project website.
What can I expect to learn from these sites?
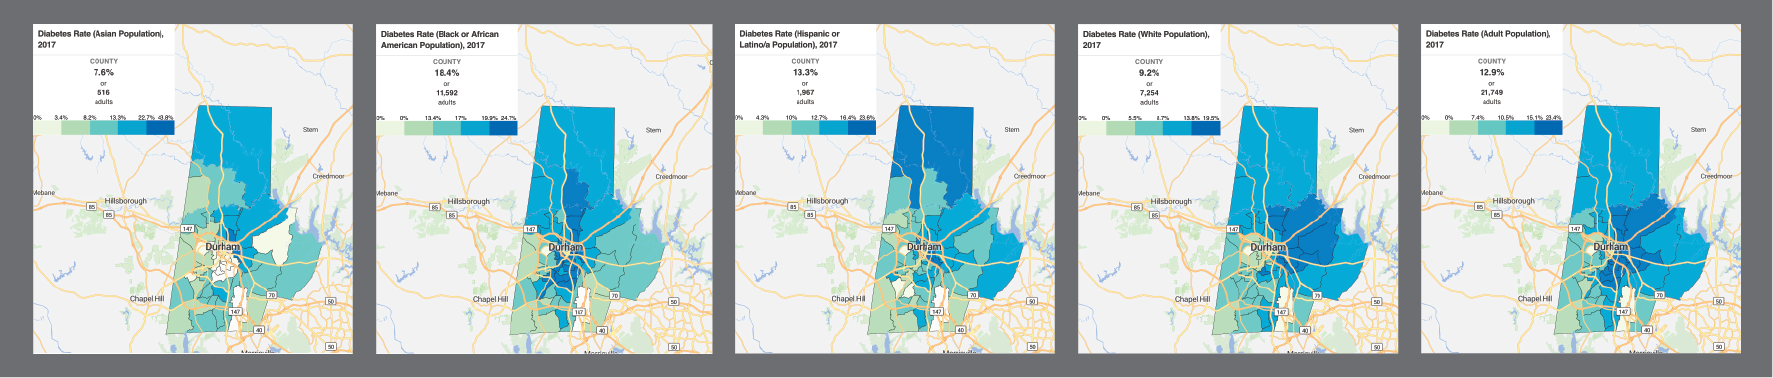
People using the Neighborhood Compass can now expect to learn about diabetes rates for their own neighborhoods in comparison with the rest of the county. The strong suit of the Compass is its wide range of information, so once you’ve discovered something meaningful about diabetes it is easy to then explore other topics like housing, income, or access to core service like clinics and bus stops. From there resources for learning more, connecting to a program for support, or getting involved in community action are a click away.
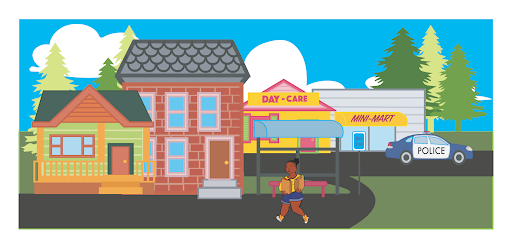
The Health Indicators site offers a more streamlined glimpse of factors that are known to influence chronic conditions: access to healthy food, physical activity, and healthcare, as well as exposure to environmental stress factors and underlying issues of race and class. And it does so in a fairly novel way, with data points driving street scene illustrations instead of maps. The design of this site is based on ideas, critiques and feedback from a year of focus groups, community workshops, user testing, and input from the project partner agencies. In this process we frequently heard a preference for learning about these topics through infographics or comics.
To make the concept a reality we have relied on the expertise and imaginations of illustrator Q Wideman and Durham design firm Kompleks Creative. The site is translated for Spanish readers by Lina Herrera and Tony Macias of tilde Language Justice Cooperative .
Why is this necessary? Don’t other sources provide this information?
Much of what we have known about county-level chronic conditions rates has come from the national Behavior Risk Factor Surveillance System reporting, commonly called BRFSS (pronounced “burfus”). This national survey yields county-level estimates, but has not surveyed Durham County residents. So for years the County Public Health Department has done its own surveying to learn what Durham residents experience and care most about regarding their health. These surveys remain a crucial tool for knowing what our neighbors need to thrive.
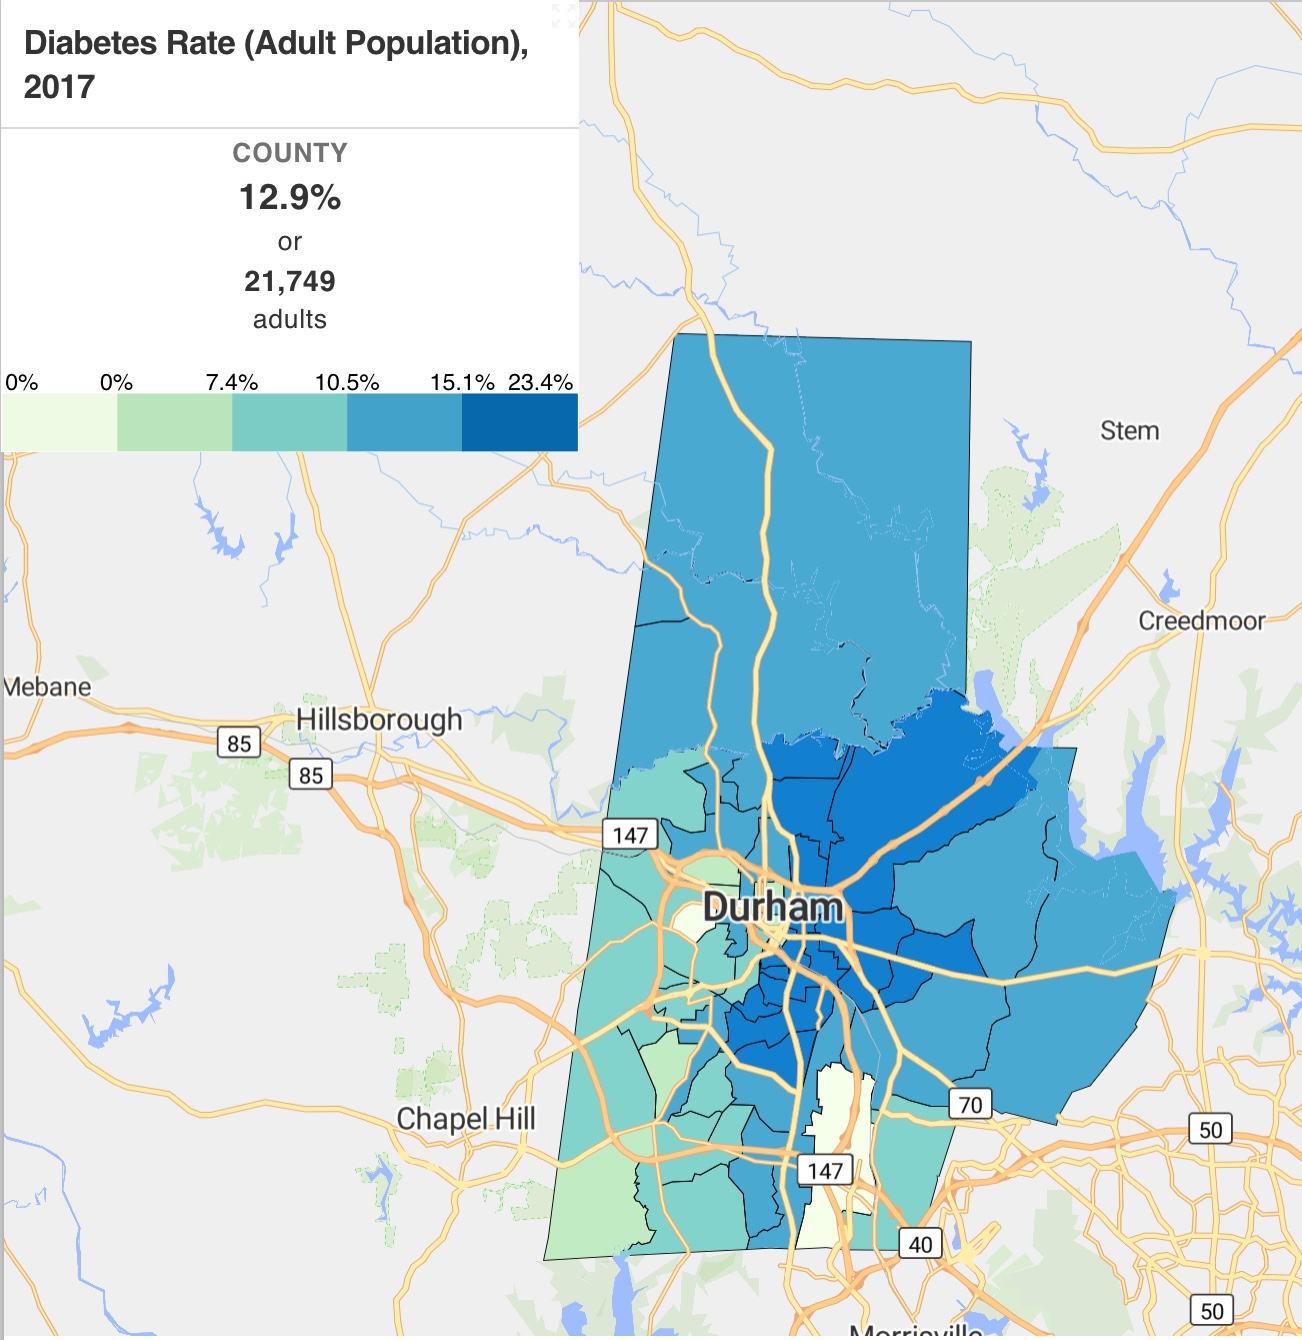
But estimates derived from these survey data have only been available for the county, providing little help when Public Health is asked “what about my neighborhood?” (500 Cities has changed that by publishing Census tract estimates, but they are also based on the same BRFSS surveys.) Certainly the county rate masks a great range of diversity – areas of high rates and low rates. If we don’t know where those differences are we’re at a great disadvantage to tackle public health challenges.
The recognition that Duke Health handles the majority of health contacts in the county and also manages Lincoln Community Health Center’s records prompted this collaboration to see if it would be possible to answer the need. Now it is.
What can you do with the information from these sites?
Data are about people – they represent individuals, groups and communities as well as their physical surroundings. For that reason data truly belong to the people described and so we hope these resources are directly relevant to the stories you need to share about where you live. Durham is a county with many neighborhoods, organizations, and opportunities to take action for change. New opportunities like Participatory Budgeting point to how data can support your case for needed change, whether small or large. If we can help you navigate these resources to make that happen, please let us know!